


UNLOCK THE VALUE IN YOUR PAYROLL AND HR DATA
Reporting and analytics
Empower leaders and functional teams with insights to drive better decision making and smoother operations. Power BI brings streamlined analytics direct to your HR and payroll teams through embedded analytics within ResourceLink. As well as reports for everyday use, get reports for audit and compliance, and deliver strategic information to leadership teams.
ZellisONE meets all of your payroll and HR reporting software needs in a single platform, enabling you to fully unlock and utilise the true potential of your organisation’s data.
At its heart is the Zellis Intelligence Platform, which integrates and transmits data seamlessly between Zellis solutions and third-party apps. It enables powerful cross-product analytical capabilities to help you:
- Unearth trends in your workforce
- Forecast future developments
- Execute precise, data-driven decisions


Market-leading HR analytics
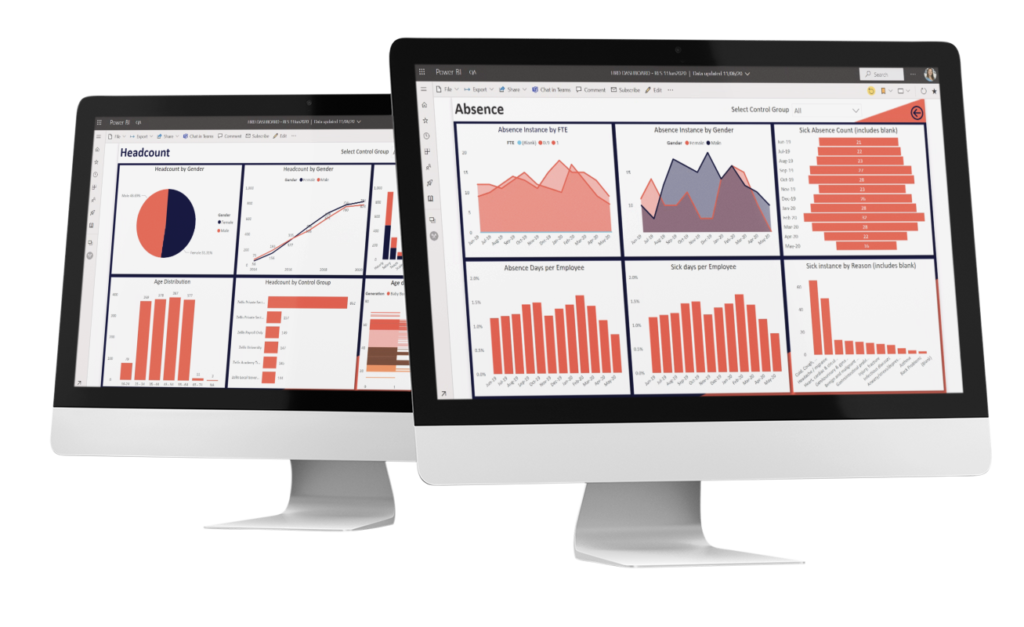
Powered by Microsoft’s Power BI, the HR Director Dashboard is a self-service analytics tool designed to present the key business insights you need without delay or room for misinterpretation.
With an easy-to-use graphical interface and powerful visualisations, it’s accessible directly from within Microsoft 365 or embedded within our payroll and HR solution. Analyse headcount, attrition, sickness, and compensation using the HR Director Dashboard.
Identifying trends and patterns, predicting outcomes, and making more informed decisions has never been easier.
Track crucial patterns and trends

Turnover
View staff turnover as a percentage rate, month-on-month or annually for any period. Indicators show if the trend is up or down, based on a comparison of current and previous periods.

Compensation
View the total salary paid in any given month, regardless of the pay frequency. A trend indicator provides easy comparison.

Headcount
Access the overall count of current employees at the start of each month, with an indicator showing any change in trend.

Absence
View incidences of absences across selected groups of employees, with a month-on-month total. A trend indicator is also provided.
Payroll dashboard
The Zellis Payroll Dashboard helps visualise payroll data from the Zellis Intelligence Platform to aid users track and analyse payroll trends. It’s fuelled by Power BI and designed to streamline payroll analytics for end users.
It covers:
- Operational Dashboard
- Payroll Exceptions
- Net Pay Analysis
- Payroll Trend Analysis
- Pay Data Analysis for Managers
- Pattern Analysis
- Exploratory Analysis

Key HR and payroll reporting and analytics features

Integrated payroll and HR reporting
Our reporting tool captures data from our payroll and HR solution. Choose from 200+ preconfigured reports.

Interactive dashboards
Configure dashboards not only for operations, but also for payroll cost analysis, gender pay reporting, and attendance.

Automated reporting
Set up an unlimited number of automated reports, delivered directly to a secure, centralised, and shared location.
Automate, configure, deliver
Fuelled by automation, our HR and payroll reporting software and analytics tools allow you to spend less time building and delivering reports, and more time deriving insights from them.
Configure interactive dashboards for a variety of roles, such as:
Manager dashboard
Through this dashboard, managers can:
- Track incoming employees with onboarding reports
- Review attendance information
- Manage performance detail
Executive dashboard
Display different views to report on:
- Starters and leavers
- FTE headcount
- Number of employees nearing retirement

Operational dashboard
Report on a wealth of information, including:
- Attendance
- Payroll categories
- Salary growth trends
DEI dashboard
Our DEI dashboard empowers HR and business leaders to visualise insights, identify action areas and measure progress in DEI initiatives.
Easily view and analyse data on workforce composition, joiners, leavers, and movers. The DEI data health check page lets you view the data provided by the employees on their characteristics.
We help you make the diversity and inclusion decisions which are critical to allowing you to expand your talent pool, drive performance, and increase engagement.

Get the most out of your reports
No matter how data-savvy you are, it’s always good to have insightful visualisations and easy-to-understand reports on hand.
The BI experts at Zellis can help you benefit from the latest reporting and analytics tools within Zellis HCM Cloud. Together, we can set up reports and dashboards to identify key trends and data sets, help you analyse data, and present results and recommendations to dig down to those hidden insights.
Ready to unlimit what’s next?
Experience first-hand how our solutions can transform your organisation.
Trusted by leading global clients
